Stanford University
CESTA

This website is no longer updated and has been replaced with a static copy. The Spatial History Project was active at Stanford University from 2007-2022, engaging in dozens of collaborative projects led by faculty, staff, graduate students, post-docs, visiting scholars and others at Stanford and beyond. More than 150 undergraduate students from more than a dozen disciplines contributed to these projects. In addition to a robust intellectual exchange built through these partnerships, research outputs included major monographs, edited volumes, journal articles, museum exhibitions, digital articles, robust websites, and dozens of lightweight interactive visualizations, mostly developed with Adobe Flash (now defunct). While most of those publications live on in other forms, the content exclusive to this website is preserved in good faith through this static version of the site. Flash-based content is partially available in emulated form using the Ruffle emulator.
Publications > Table of Contents > What is Spatial History?
Spatial History Lab: Working paper; Submitted 1 February 2010;
What is Spatial History?
Richard White 1
1. Past Director, Stanford University Spatial History Project
The Spatial History Project at Stanford is part of a larger spatial turn in history. It is a humble —if demanding and expensive— attempt to do history in a different way. I want to emphasize humble. Most so-called “turns” in history emphasize their revolutionary intent. I think that what we are doing is different, but we are not announcing the end of history as you know it or the extinction of the text or the narrative. Historians will continue to write books. Historians will continue to tell stories.
2
The Spatial History Project, however, does operate outside normal historical practice in five ways. First, our projects are collaborative. Many of the things that visitors to our web site see involve collaborations between an historian, graduate students and undergraduates, geographers, GIS and visualization specialists, data base architects, and computer scientists. The scholars involved in the Spatial History Project can write books by themselves, but they cannot do a spatial history project on the scale they desire alone: we lack the knowledge, the craft, and ultimately the time. Second, while many of our presentations involve language and texts, our main focus is on visualizations, and by visualizations I mean something more than maps, charts, or pictures. Third, these visualizations overwhelmingly depend on digital history. By digital history all I mean is the use of computers. Digital history allows the exploitation of kinds of evidence and data bases that would be too opaque or too unwieldy to use without computers. It is all the stuff that we cannot narrate, or at least narrate without losing our audience. All historians run across such evidence in the archive. We look at them and toss them aside. For me railroad freight rate tables are the quintessential example. Fourth, these projects are open-ended: everything —both tools and data— becomes part of a scholarly commons to be added to, subtracted from, reworked and recombined. The final, and most critical aspect of our departure from professional norms is our conceptual focus on space.
3
Historians by definition focus on time. Chronology will always remain at the heart of a discipline that seeks to explain change over time, but this has left historians open to the charge from geographers that they write history as if it took place on the head of a pin. The charge is not true, but sometimes it is uncomfortably close to being true. Many of the classic histories of the last half-century and more — from Fernand Braudel’s Mediterranean World to William Cronon’s Nature’s Metropolis — have been spatial in the sense that changing spatial relations that best explain the pattern of changes over time. When William Cronon republishes the old chart from Charles Paullin showing changing times of travel from New York City to various parts of the United States, he gives a graphic representation of the interrelation of time and space.
4
Figure 1. Rates of Travel from New York City, 1830 and 1857 by Charles Paullin, 1932
From William Cronon’s book, Nature’s Metropolis: Chicago and the Great West, published by W.W. Norton & Co. in 1991. This chart shows decreasing travel times between 1830 and 1857 from New York City to points West. These changes were almost entirely due to the expanding American railway system1.
5
This is an early example of what I am calling spatial history. The problem with citing exceptional spatial histories, however, is that these histories are exceptional. Historians still routinely write about political change, social change, class relations, gender relations, cultural change as if the spatial dimensions of these issue matter little if at all.
6
What is surprising about this is that in terms of historical theory space has loomed large for a considerable time now. Henri Lefebvre’s The Production of Space introduced a generation of historians to the idea that space is neither simply natural geography nor an empty container filled by history. It is rather something that human beings produce over time. Spatial relations shift and change. Space is itself historical. Lefebvre, who was a philosopher and not a geographer, organized his own work around three forms of space that he called spatial practice, representations of space, and representational space. Lefebvre, of course, was French and what is often clear enough in French becomes fashionably murky in English. It need not be.
7
Spatial practice is, for example, on one scale, our movement within our homes — from bedroom to kitchen to bathroom to living room. On another scale, it is our movement from home to work along an infrastructure of sidewalks, roads and trains. A further increase in scale creates our long distance movements through airports and along air routes. Spatial practice involves the segregation of certain kinds of constructed spaces and their linkages through human movement2.
8
Figure 2. Aaron Koblin’s Flight Patterns
This still shows some of the flight path patterns of over 200,000 separate flights across the United States in a twenty-four hours period3. The data for this visualization is from the U.S. Federal Aviation Administration. You can see the entire animation at: http://www.aaronkoblin.com
9
Second, there are representations of space. These are the documents of architects, city planners, politicians, some artists, surveyors and bureaucrats. They are not separate from spatial practice because in large measure they are what guide the human labor that creates kitchens, bathrooms, living rooms, roads, train stations, airports, air traffic control and entire landscapes. Spatial representation is an attempt to conceive in order to shape what is lived and perceived. It is a tremendously powerful and ultimately hopeless set of practices. It is, among other things, the work that James Scott details and condemns in Seeing Like a State, but it is also what many of us praise or seek when we want zoning, or sewers, or regulation, or national parks, or wilderness area6. These are all representations that we hope will turn into what is perceived and lived.
10
Figure 3. Public Land Survey System
The Public Land Survey System (PLSS), as instituted by the Land Ordinance of 1785, organizes and divides American public lands into a rectangular system of 6-mile by 6-mile township/range squares which are further subdivided into 1-mile by 1-mile sections, numbered one through thirty-six. The illustration above uses Richland County, Wisconsin as an example4.
11
Figure 4. Evidence of the Public Land Survey System
Visible evidence of the Public Land Survey System (PLSS) across the United States can be seen above in the aerial landscape photos by Alex MacLean. Clockwise from top left: “Road Grid, Correction Jog, North Dakota,” “Railroads Across Survey Landscape: Castleton, South Dakota,” “Irrigation Canal and Rose Field, Bakersfield, CA” 5.
12
Finally, there is representational space. This is space as lived and experienced through a set of symbolic associations. It overlays physical space and makes symbolic use of its objects. It is what marks a church or mosque or synagogue; it is what religious people feel in a sacred space; it is a room in a library or a university building; it is an art gallery.
13
Figure 5. Chapel Interior
Churches are spaces redolent with symbolic associations. Religious spaces - like libraries, art galleries, sports arenas and graveyards - are more than locations or buildings. They represent a particular lived experience7.
14
Lefebvre’s triad are mutually constitutive; they are not separate categories in an abstract model. Human beings, who create all three, can, but do not always, move seamlessly between them. Lefebvre’s triad does not always, or even usually, add up to a seamless or congruent whole. His space, as he admits, is full cracks and fissures8.
15
Historians’ embrace of Lefebvre has been partial. They pay, I think, more attention to the language of spatiality than to the spatial experience, but many of the projects on this web site are more interested in spatial experience and spatial practice than language, and this has forced us to ask some hard questions. What operationally do we mean by spatial experience and what specifically are we studying? How does spatial experience connect to the production of space? And, finally, how are spatial relations constructed?
16
My colleagues have different and more sophisticated answers, but for me, all three of these questions end up having a single answer: movement. I don’t want to be so simplistic as to say that if space is the question then movement is the answer, but I fear that I am nearly that simple. We produce and reproduce space through our movements and the movements of goods that we ship and information that we exchange. Other species also produce space through their movements. Spatial relations are established through the movement of people, plants, animals, goods, and information.
17
It would be wrong to argue that narratives and maps cannot represent movement. A history of the Oregon trail or the wonderful maps by C. J. Minard of Napoleon’s invasion of Russia both represent movement. We use similar devices in the spatial history project. Maps and texts are critical for representations of space, but representations of space cannot be confined to maps for a simple reason: maps and texts are ultimately static while movement is dynamic10.
18
Figure 6. Napoleon’s March by Charles Joseph Minard
This classic map by Charles Joseph Minard of Napoleon’s March shows the losses sustained by the French Army during the 1812 Russian Campaign. The map succeeds in combining five different variables: the size of the army, time, temperature, distance, and geographic location9.
19
This brings me to new technologies, which are by no means uncontroversial. Historians like myself who advocate the use of these technologies can be accused of having deserted the forces of light and embraced the forces of reaction. The great appeal of GIS to historians is its ability to make historical maps commensurate with modern space and mapping conventions. Because of mistakes in projection even maps like the early U.S.G.S. quads have to be georeferenced. We can georeference, or correct them so that they correspond to modern projections of the globe. Anyone who has seen the Google Map site and looked at David Rumsey’s georeferenced maps knows what I mean.
20
Figure 7. Georeferenced USGS Quads in ArcGIS and USGS Quads in Google Earth
These illustrations demonstrate the process of georeferencing 2D maps to their physical location on the 3D earth. The first illustration shows georeferenced USGS quads of Central California superimposed in the correct space on a Google Earth landscape. The second image shows a georeferenced historic USGS quad of San Mateo County.
21
ArcGIS is a remarkable, if often times consuming and unwieldy, tool, but it allows the orientation and coordination of dissimilar things — an aerial photograph and a map, for example — in terms of a single location. It allows us to merge things created at dramatically different times to create what are, in effect, new modern images which potentially reveal things about the past that the original artifacts did not11. It also allows us to visualize space in ways that go far beyond mapping, as in the airline routes or as in this representation that Jon Christensen put together for Botanizing California.
22
Figure 8. Comparing Layers
This example, taken from Jon Christensen’s Critical Habitat project through the Spatial History Lab, shows how easily different data sets can be compared when they concern the same geographic space. In this case, he compares a digital base map with a USGS quad, an aerial photograph and several digitized polygons signifying geologic soil types and plant habitats. Christensen used this data to investigate the influence of land preservation and conservation on the extinction of the Bay Checkerspot Butterfly. You can read more about his project at the Spatial History Project website: spatialhistory.stanford.edu.
23
Figure 9. Botanizing California
This visualization, also from Jon Christensen’s Critical Habitats project, was created by Aaron Koblin using data from nearly half a million botanical specimen records stored in herbaria throughout California. It raises questions about the patterns of botanical collecting over time, the construction of knowledge about California’s environment, and the ways that these historical sources might be used to explore questions about the present and the future as well as the past.
24
GIS is itself a representational space, but its users and sometimes its creators seem oblivious of its representational aspects. Everyday users of GIS rely on the technology to understand where they are on a map and find a route to where they want to be on the map. What they depend on is a correspondence between the map and what I will call absolute physical space. By absolute space, I mean space measured by distance: inches, feet, meters, miles, etc. When we use the technology we mark the fixedness of things: streets, buildings, parks and the rest.
25
Figure 10. Absolute Space in Google Maps
Whenever we search online for directions from one place to another, we automatically locate ourselves within a fixed, physical environment. This is “absolute space.” Here, space is measured by distance: inches, feet, meters, miles, etc. Our choice of what route to take when traveling between destinations depends on the distances of different possible routes. However, our choice also depends on less tangible factors: how long it might take to arrive at our destination depending on the time of day during which we are traveling, the cost of transportation (are we driving a car, taking a bus, walking?) or the landscapes through which we might need to travel. Distance belongs in absolute space. The later three factors belong to relational space12.
26
Thus GIS often ends up emphasizing not the constructed-ness of space but rather its given-ness, which is fine if you are setting out to bomb something or go out to eat, but not so good if you are trying to understand a wider spectrum of human constructions of space over time.
27
A georeferenced map is a first step, but because it depends on absolute space, it has definite limits for historians. The first is obvious: not all peoples at all times have constructed space in ways that can be easily made commensurate with absolute space.
28
The second limit of absolute space is that even in Western cultures it is not the dominant space of spatial practice. In everyday experience, people talk about space in terms of miles, but they also do it in terms of time and cost. When space or distance is measured by these non-linear measures, I will call it relational space. In contemporary terms, Palo Alto, where Stanford is located, is nearer to San Francisco at 10:00 in the morning than at 7:30 in the morning or at 5:00 in the evening because it takes less time to get there. Depending on the cost of airline tickets Paris or Melbourne or Shanghai is more or less accessible to Los Angeles at some times than at others. This is relational space.
29
One of the nice things about using ArcGIS is that you actually have to create and think about the different kinds of representation of space that you are using. You have to construct different layers of space and fit them together. We literally produce representational space in the spatial history lab. These, for example, are some of the layers my colleague Zephyr Frank is working with in his reconstruction of nineteenth-century Rio.
30
Figure 11. Sample Layers: GIS and History, Rio de Janeiro in the 1840s-70s
This visualization, taken from Zephyr Frank’s Terrain of History project at the Spatial History Lab, combines different layers of relational space into one geographic region. Using these layers, we can compare the topography of Rio de Janeiro with property values for different parts of the city, with historic streets and geocoded addresses, all superimposed on a historic base map. Comparing different relational spaces allows us to ask more complex questions and hypothesize connections about the geographic space.
31
In my own work on transcontinental railroads, I have tried to move between absolute and railroad space in visualizations. Railroads were lines along which machines ran stopping at designated points. This is the infrastructure of railroads and it is best rendered as absolute space. If we imagine these lines through absolute space as the hardware of railroads, then the rates and schedules were the software. It was the software that constructed relational space. I don’t think we can recover the implications of these rates and schedules without using computers to visualize the data and the implications for the movement of goods and thus the construction of space.
32
Figure 12. Extent of Digitized Railroad
This map from the Shaping the West project shows the extent of the digitized historic railroads and stations, colored according to company ownership. These rail lines were digitized from the oldest available USGS topographic quads, in the attempt to show the original locations of the railroads.
33
Figure 13. Southern Pacific Freight Rates
This sample freight table from the Southern Pacific railroad lists the special rates of shipping grain, flour, hay, livestock and wool to market along the railroad. Because wheat was such an important product of California in the late 19th century, these special grain rates are particularly significant. Visualizing the relational space created by these grain rates reveals patterns previously hidden in these dry, numerical charts and allows researchers to begin to understand why the farmers of the San Joaquin valley were so angry with the railroads13.
34
The distortion visualization14, for example, is difficult for a casual viewer to decipher, and this is necessarily so, because the visualization is itself a research tool. It is a way of analyzing information more than a finished representation of the conclusion. It is useful for trying to understand how changes in the software (rate table) created changes in spatial relations for producer and consumers in nineteenth-century California.
35
One of the important points that I want to make about visualizations, spatial relations, and spatial history is something that I did not fully understand until I started doing this work and which I have had a hard time communicating fully to my colleagues: visualization and spatial history are not about producing illustrations or maps to communicate things that you have discovered by other means. It is a means of doing research; it generates questions that might otherwise go unasked, it reveals historical relations that might otherwise go unnoticed, and it undermines, or substantiates, stories upon which we build our own versions of the past.
36
End Notes

1 William Cronon. Nature’s Metropolis: Chicaco and the Great West. New York: W.W. Norton & Company, 1991.

2 Lefebvre, Henri. The Production of Space. Chicago, Illinois : Blackwell Publishing Limited, 1991. pp.37-41.

3 Aaron Koblin. Flight Patterns. 2008. http://www.aaronkoblin.com.

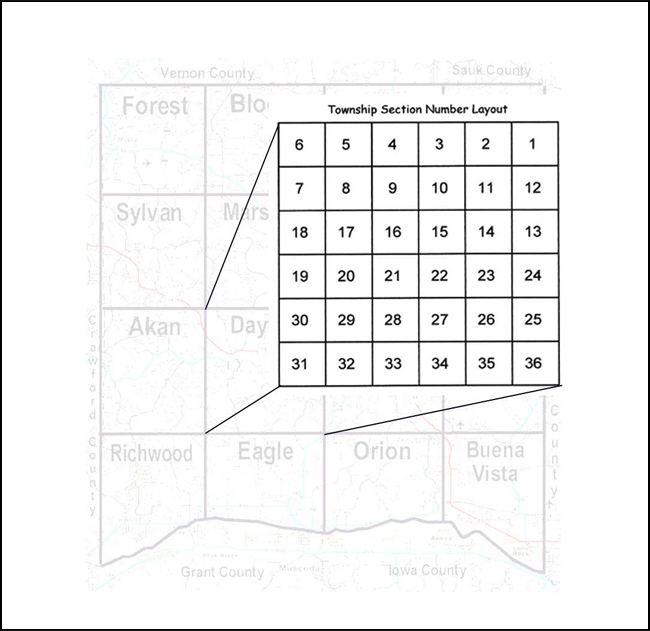
4 Township Section Guide, as explained by rootsweb, http://freepages.genealogy.rootsweb.ancestry.com/~djnsl/SectionGuide.html.

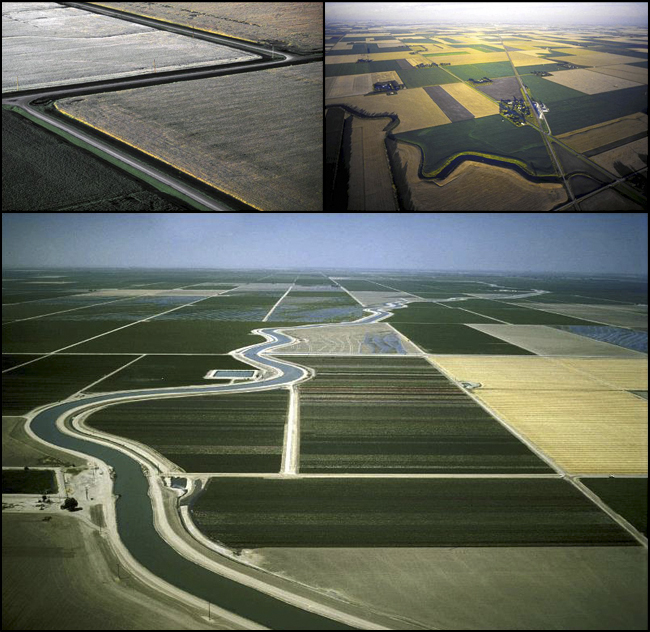
5 Alex MacLean. Aerial Landscape Photography. http://www.alexmaclean.com.

6 James C. Scott. Seeing Like a State: How Certain Schemes to Improve the Human Condition Have Failed. New Haven: Yale University Press, 1999.

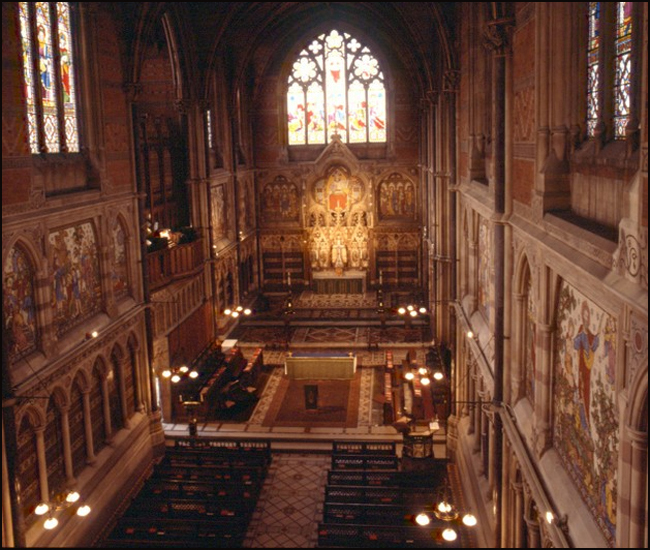
7 Chapel Interior. Keble College, Oxford. http://www.keble.ox.ac.uk/about/chapel/chapel-services/Chapel%20view.JPG/view.

8 Henri Lefebvre. The Production of Space. Chicago, Illinois: Blackwell Publishing Limited, 1991. p.40.

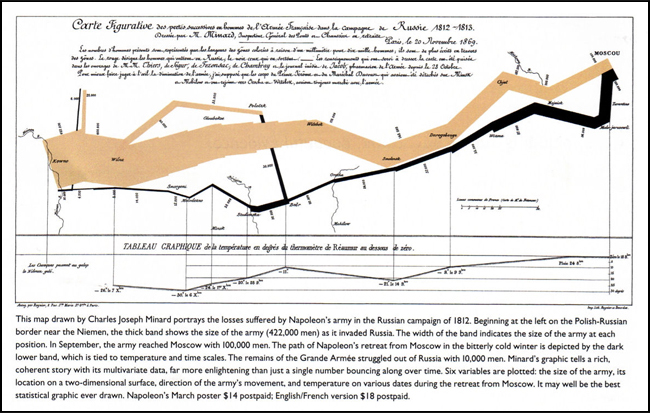
9 Charles Joseph Minard. Carte figurative des pertes successives en hommes de l’Armee Francaise dans la campagne de Russie 1812-1813. 1869. http://www.edwardtufte.com/tufte/posters.

10 A forthcoming series of essays edited by Anne Knowles makes this point, see particularly, Ian Gregory, “A Map is Just a Bad Graph.” Knowles, Anne, ed. Placing History: How Maps, Spatial Data, and GIS Are Changing Historical Scholarship. Redlands: ESRI Press, 2007. p.123.

11 Ibid.

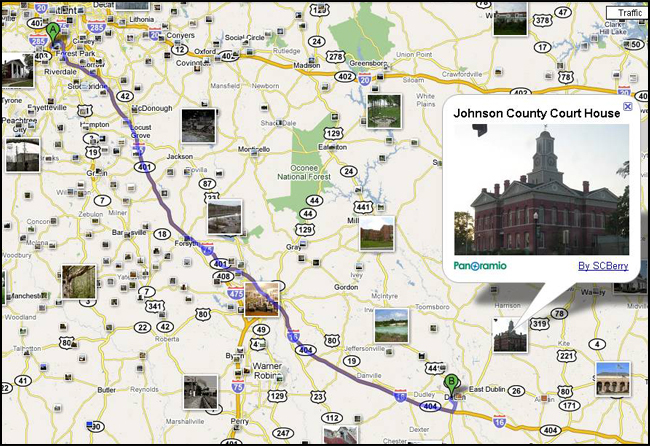
12 Google Maps. http://maps.google.com.

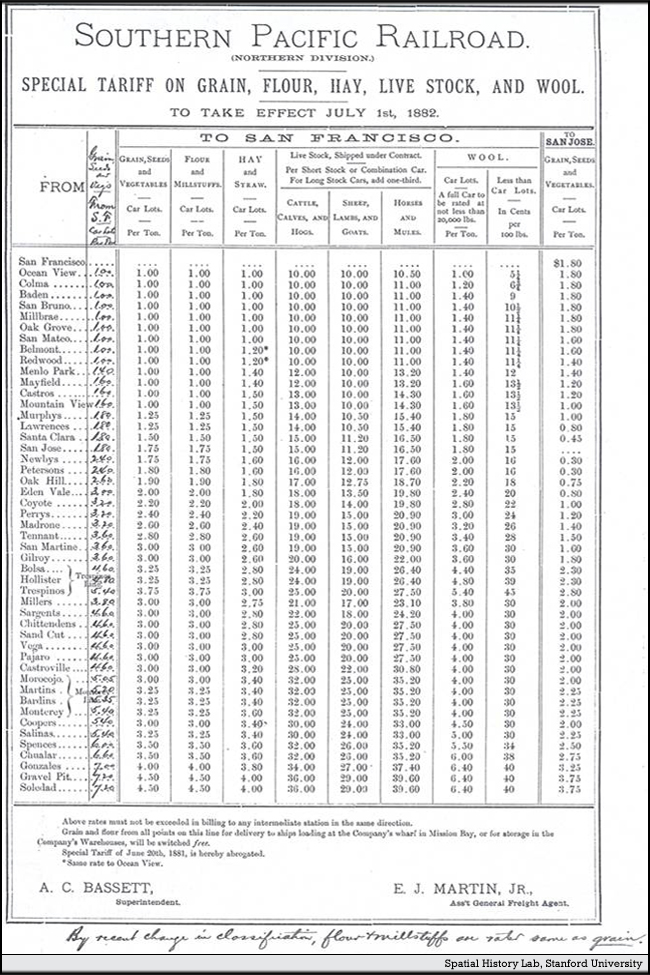
13 Freight Rates, Southern Pacific Railroad Company, 1882.

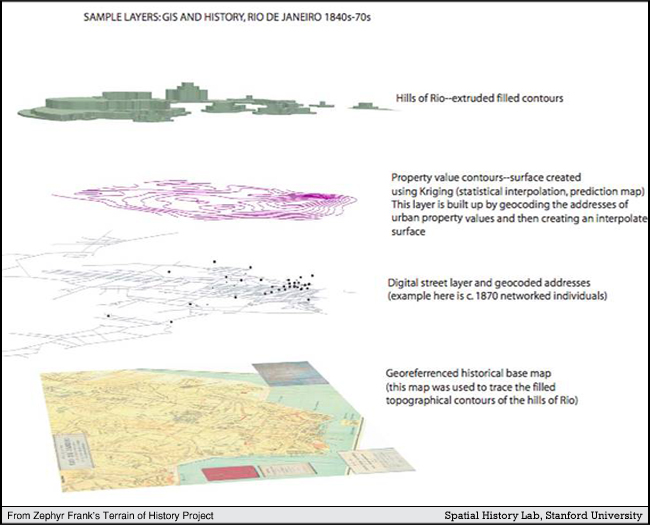
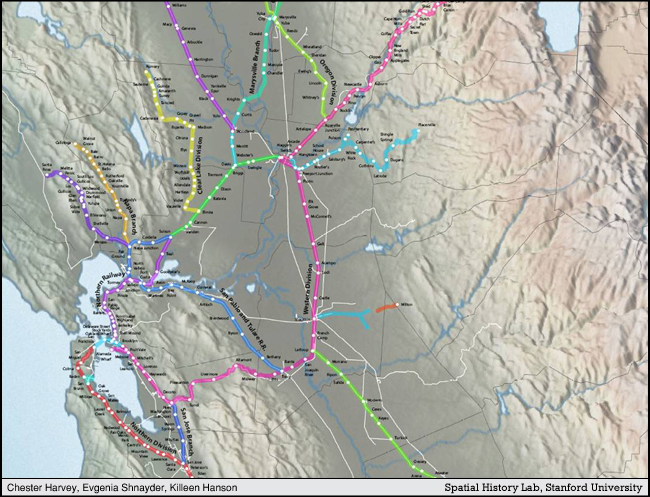
14 Distortion Visualization, Spatial History Lab